Engineering first. Curiosity always.Copenhagen / Open to opportunities
↖ Back to additional engineering projects

Engineering & Innovation07 / 08

Research · Data Visualization · Graphic Design

The Psychology
of Waiting.

Original title / Den gode transportoplevelse

The same minutes.
A different experience.

Exploring perceived waiting time in public transport through interviews, a survey and visual communication.

View my poster design ↓
Period
First semester
University group project
My role
Collaborative qualitative & quantitative research
Science fair poster · Graphic design & visualization
Tools & methods
Interviews · Survey design
Data visualization · Graphic design
Context
Technical University
of Denmark (DTU)

01 / Introduction

What shapes
the wait?

What factors influence how people perceive waiting time when using public transportation?

This was the question my team explored during our first semester at DTU. The project connected qualitative and quantitative methods with the challenge of communicating research to an audience.

We gathered passengers’ perspectives at bus stops, used those interviews to develop a survey and presented the work through a science fair poster. I personally designed the poster, translating our shared research into a visual presentation.
02 / Research process

From a question
to a poster.

Background research helped frame the investigation. Interviews then informed the survey, connecting the team’s qualitative exploration with quantitative data collection.

  1. 01

    Literature &
    background research

    Explore existing research relevant to perceived waiting time.

  2. 02

    Bus stop
    interviews

    Talk with passengers while they wait for the bus.

  3. 03

    Survey
    development

    Use interview insights to shape the survey questions.

  4. 04

    Data
    collection

    Distribute the survey and collect quantitative responses.

  5. 05

    Science fair
    poster

    Bring the research together in a visual presentation.

03 / Visual communication

Shared research.
My graphic design.

My responsibility was to make the research engaging and visually understandable.

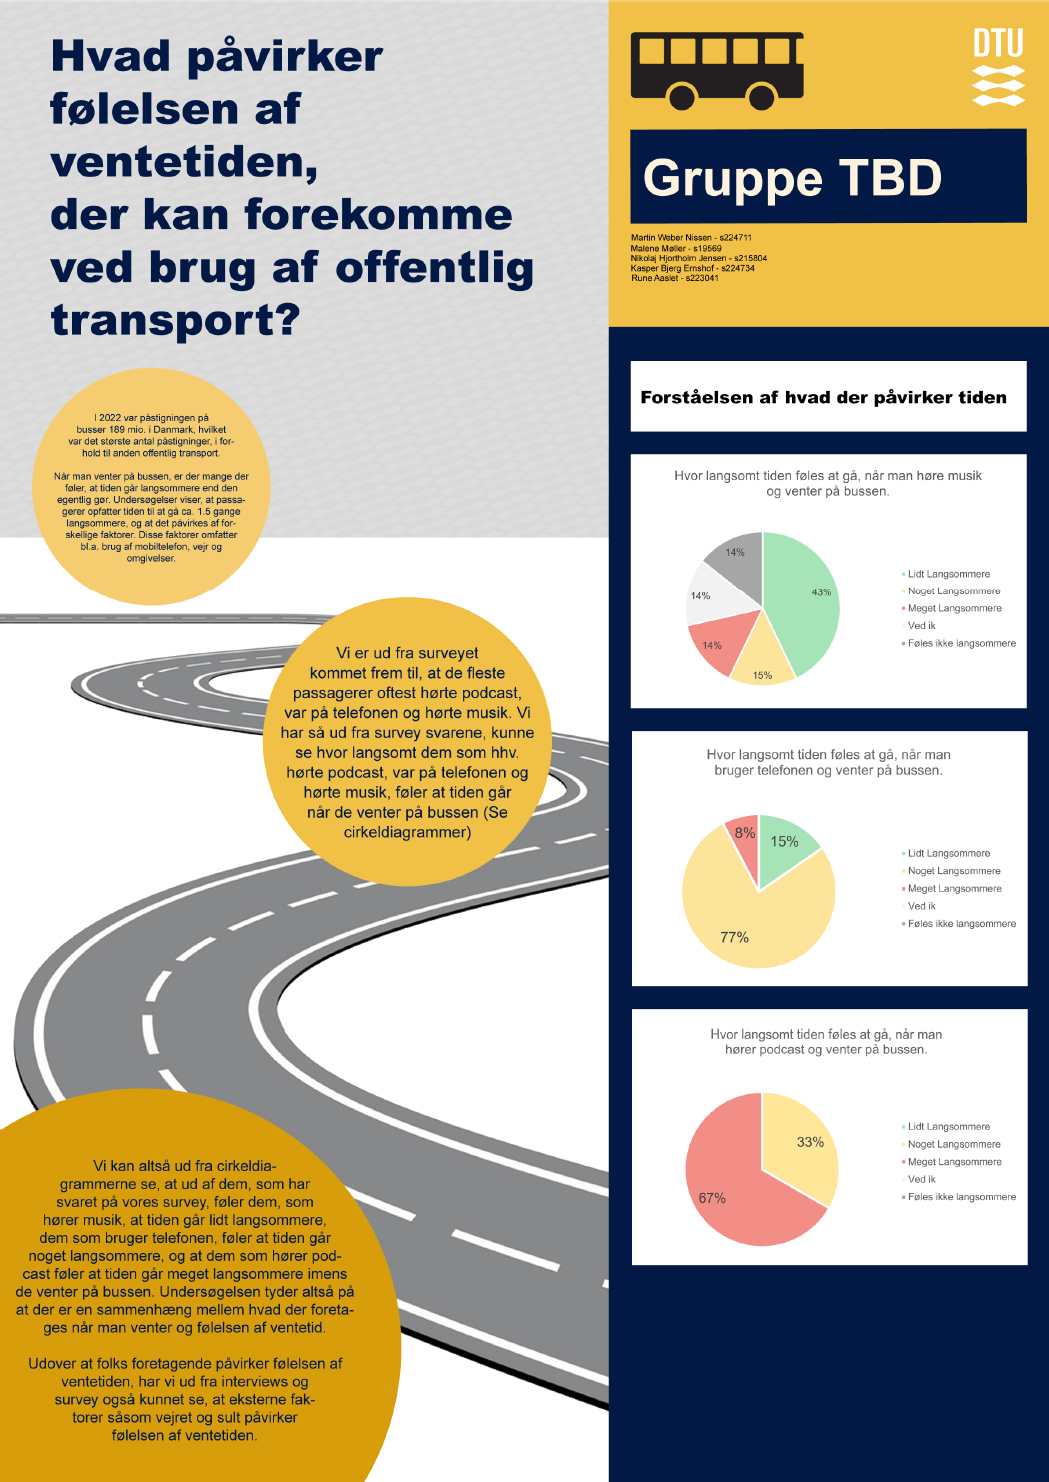
I designed the science fair poster using typography, charts, color and transport-inspired graphics. The bus and winding road connect the subject to its visual presentation; yellow and dark blue organize the composition.

The layout brings together the research question, written explanations and charts of the survey responses. It gave me an early opportunity to connect data visualization with graphic design and research communication.

Visual languageBus and road illustrations · Yellow and dark blue

Information designType hierarchy · Chart placement · Research narrative

04 / Final poster

The original
science fair poster.

Designed by me for our university group project. The original Danish poster is preserved below as it appears in my earlier portfolio.

Recovered from a screenshot at 1049 × 1482 pixels. Small text is limited by the source resolution. No text, chart values or illustrations have been redrawn.

Open the poster image ↗
Original Danish science fair poster about perceived waiting time in public transport, with yellow and navy panels, a bus, a winding road and three survey pie charts
Original poster / Collaborative DTU research · Poster design by Rune Aaslet. Select to enlarge; press Escape to close.

05 / Learning

Research meets
visual communication.

An early experience in connecting research methods with a designer’s way of communicating.

The project gave me practice moving from qualitative interviews to survey development and quantitative data collection. Designing the poster added another task: selecting a visual hierarchy and bringing the research into one coherent composition.

I learned to work with research collaboratively while taking responsibility for how the work was presented.

This case focuses on the research process and poster design. It does not establish a sample size, statistical validity or causal effects, and does not reinterpret the screenshot’s chart values.

  • Qualitative Research
  • Interviews
  • Survey Design
  • Quantitative Research
  • Data Visualization
  • Graphic Design
  • Visual Communication

Keep exploring / Engineering & Innovation

Mixed Reality
Laboratory Training

All engineering projects ↗
Enlarged project image